
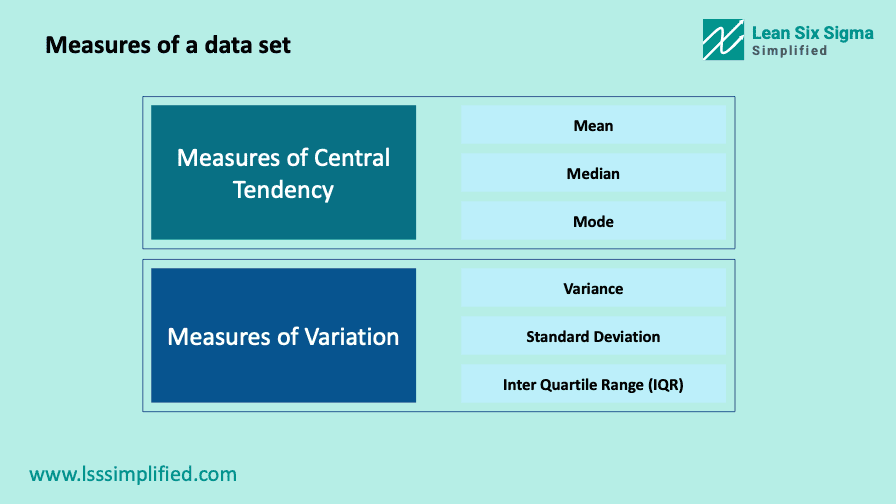
You can completely represent a data set by two key values. The measure of central tendency and the measure of variation. You need both these measures to portray the true nature of the data. In this post, we will look at what central tendency means and what are the 3 measures of central tendency. We will discuss the measures for variation in the next post. Read on!
Whenever you have a data set, consisting of multiple data points, and you need to represent this data set in your statements, you cant really use all the data points all together. You can use summary statistics for such representation. Central tendency is one such summary statistic.
Measures of central tendency is used to represent the center point of your data set. These measures usually depicts where your entire data set is concentrated or centered. Think of it as a point, around which all of your data points are clustered. Hence, measures of central tendency are also sometimes referred to as measures of central location.
The mean, or commonly know as average, is one of the most common measure of central tendency that you would be familiar with. Apart from mean, there are 2 more measures of central tendency, median and mode.
Thus, we have three measures of central tendency – Mean, Median and Mode.
We will look at all three in details. However, before we get into these, lets also understand what exactly the central point of a data set means. And then we will jump on to the three measures.
Central Tendency : Center of the data set
In one of the previous posts on probability distribution and Histograms, we spoke about the frequency distribution of a data set. (Click on the links to read more, opens in a new tab.) We saw that there are some values which repeats or occurs the most number of times. More than other values.
When you look at a typical normal distribution, the data is more concentrated at the center of the bell curve while the occurrence of data points dips at both ends. When it comes to a skewed distribution, the concentration is more on one side of the curve and less at the other side.
The measure for central tendency usually will be in the area or interval where the concentration of data points is the highest. Look at the below image to understand this better.

You can apply the same concept if you look at discrete data as well. Let’s say you ask a group of 50 people to choose one of the 5 options for the next holiday destination. The option that most number of people choose, will apparently be the centre of such a data set. Look at the below image to understand it further.

To summarize, the point or data value, where the data is concentrated the most, or where you see maximum number of occurrences, is the central tendency of a data set.
Now, let us look at the three measures, starting with Mean.
Mean
The Mean is one of the most common and widely used measure of central tendency. It is something that all of us understands since we are using it right from our childhood.
Mean is the arithmetic average of the data values in the data set.
Calculating the Mean (or Average) is very simple. You sum up all the data values in your data set and divide this sum with the number of values you have in the data set. And you get the mean of the data set.
Suppose you have a group of 10 people and you collate the monthly compensation of these 10 people. The data looks like below;
15k, 21k, 17k, 12k, 14k, 18k, 21k, 11k, 19k and 16k.
The sum of all these 10 data points is 164k. Since there are 10 values, we devide 164k by 10 to get the Mean, which is 16.4k.
There are two aspects of each measure of central tendency that we need to remember. First, the mean of the data set does not necessarily need to be a value in the data set. In the above example, 16.4 k is the mean of our data, but is not part of the 10 values in the data set. Second, there is always only one unique value for mean for each data set. Importance of these aspects will become clear once we look at the other 2 measures of central tendency.
When to use Mean as the measure of central tendency
The above example also tells us that, mean as a measure, includes all the values in the data set. If any of these values change, the mean of the data set will also change. Hence, mean is very sensitive to the the data values, specially to the extremely smaller or larger values.
If any of the value in the above data set changes, the mean will also change. Suppose, you replace the 1st person with a person from the leadership, with significantly higher compensation, the mean will increase. Lets say, the member from leadership team earns 100 k per month. The new sum will be 249 k and the new mean will be 24.9 k.
This new mean does not represent the actual center of our data set. This is because, the data now does not follow a symmetric distribution. It follows a skewed distribution and is skewed towards the higher end of the data. Hence, in such cases, mean is not the correct measure for central tendency.
You should use Mean as a measure for central tendency only when you have continuous data and the data set follows normal distribution (opens in a new tab).
Median
Median is the middle value of the data set. Simple! It is the value in your data set which divides or splits the whole data set into half. This means, half of your data values will be greater than the median and the other half will be smaller than the median.
To know the median of your data set, you first sort it into ascending or descending order. And then pick up the middle value. This works best when you have odd number of data points in your data set.
When you have even number of data points, there is no middle value. In such cases, you pick up the 2 middle values and take their average. This is the median. Look at the below image to understand with an example.

As you can see from the above example, median can be a value from the data set itself, as is the case when you have odd number of data values. However, when you have even number of data values, the median will not be the actual value from the data set. Also, just like mean, there can always be only one unique value of median for a data set.
When to use Median as the measure of central tendency
As is evident in the above example, unlike mean, median as a measure is not very sensitive to individual data values. Specially to outliers.
Lets say you replace the couple of data values in the above example by greater values (30 by 300 and 28 by 280). The mid point will still be the same. Hence, the median will be the same. Thus, even if the data is skewed and not symmetrical, median still holds true to be the central point of the data set.
You should use Median as a measure for central tendency when you have continuous data and the data set follows Non-Normal Distribution.
Master Lean and Six Sigma Acronyms in No Time!
The Ultimate Guide to LSS Lingo – Yours for Free
Subscribe and Get Your Hands on the Most Comprehensive List of 220+ LSS Acronyms Available. No more searching for definitions, no more confusion. Just pure expertise at your fingertips. Get your free guide and other ebooks and templates today. Download Now!
Mode
Mode is the value in your data set that repeats or occurs the maximum number of times. If you have 2 or more values that are repeating the maximum number of times, all such values are the modes and you have multi-modal data set.
Thus, for a data set, you will always have only one mean and one median but can have one or more than one modes.
There will also be a chance that you end up with a data set in which none of the values repeat. For example, theoretically, it is highly unlikely for a continuous data set to have repeating value as there can be infinite number of values between any two values. Such data set will not have a mode.
When you look at a histogram, the longest bar is your mode. If there are two or more bars which are the longest, all of them are the modes of the data set.
By the way, do check out the Certified Lean Six Sigma Black Belt Handbook – it is one of the most essential guide for anyone trying to get certified as LSS Black belt or in general wants to understand LSS and improve processes. – check it out here.
When to use Mode as the measure of central tendency
Mode as a measure of central tendency is most appropriate when you have categorical data. In the third image above in this post, we represented the data from 50 people voting for the next holiday destination. Most number of people voted for Spain. Spain was the most repeating choice in the data set, ie the mode of the data set. And it correctly summarizes the choice of these 50 people as well.
Mode can also be used when you have discrete data. However, in such data sets, the mode will not always be at the center of the data. It is the most frequently occurring value and can be anywhere in the data set.
You should use mode as a measure of central tendency when you have discrete, ordinal or categorical data set.
Master Lean and Six Sigma Acronyms in No Time!
The Ultimate Guide to LSS Lingo – Yours for Free
Subscribe and Get Your Hands on the Most Comprehensive List of 220+ LSS Acronyms Available. No more searching for definitions, no more confusion. Just pure expertise at your fingertips. Get your free guide and other ebooks and templates today. Download Now!
Other measures of central tendency
Apart from the the measures discussed above, there are a few other measures of central tendency which can be used in different scenarios. Those are Geometric mean, Harmonic Mean, Weighted arithmetic mean, Truncated mean, Interquartile mean, Midrange and so on.
Since we are discussing measures of central tendency from a Lean Six Sigma perspective, we do not need to get into the details of these measures. Mean, Median and Mode are the 3 measures that are relevant and sufficient for a Lean Six Sigma practitioner for his/her project.
In case you are curious, please read about these measures on Wikipedia. Click here to read. (Opens in a new tab)
In the next post, I discuss the measures of variation. Do read.
Do let me know if there is anything I missed or if you have any comments / questions in the comments section below. I will surely get back to you. Don’t forget to subscribe so you wont miss on the latest posts!

Sachin Naik
Passionate about improving processes and systems | Lean Six Sigma practitioner, trainer and coach for 14+ years consulting giant corporations and fortune 500 companies on Operational Excellence | Start-up enthusiast | Change Management and Design Thinking student | Love to ride and drive


We learnt measures of central tendency, all these Mean Median and mode in school, but these aspects were never covered. Good to revisit these concepts. Thank you!